


Trump's Rescissions Package Could Wipe Out Station Cash
Rescission Day, take two.


As a wise man once said, “The years start coming and they don’t stop coming.” If you work in public media, you’ve probably recently been measuring years in months. Or perhaps weeks. Maybe even days.
Yesterday, the White House Office of Management and Budget added to public media’s terrible, horrible, no good, very bad year:

As CBS News reported, the package would return approximately $1.1 billion in funding already appropriated to the Corporation for Public Broadcasting for fiscal years 2026 and 2027 back to the government. Additionally, the package would “claw back” $8.3 billion from USAID. Now that it’s been sent to Congress, both chambers have 45 days to pass the package with a simple majority.
This news isn’t really a surprise - in my first full Semipublic post, I mentioned that public media workers had been expecting the rescissions package to be sent on Monday, April 28th. Instead, President Trump signed an executive order the following four days demanding that CPB and all of its grantees stop funding NPR and PBS (directly or indirectly) as well as released a budget outline that completely eliminated CPB. Both NPR and PBS are suing the government for First Amendment violations related to the executive order, but the reality is that the rescissions package is an act of Congress…something public media would be more or less powerless to challenge in court.
An Abundance of PDFs
So far, Semipublic has explored public media’s true dependence on federal funding in depth: How much stations rely on the government on average, how the funding makes its way through the public media ecosystem, and which stations would be most vulnerable following the loss of federal funding. All of those insights were gleaned from Annual Financial Reports (AFR) or Financial Summary Reports (FSR), one of two documents public media stations are required to submit to CPB in order to receive federal funding from the corporation.
The other document CPB grantees are required to submit are Audited Financial Statements (AFS). Unlike an AFR or FSR, an AFS is completed by a certified public accountant and may differ in structure from station to station. Nevertheless, all AFSes contain three key components: Assets and liabilities statements, revenues and expenditures statements, and cash flow statements. Basically, it serves as a supporting document, backed by an independent expert, for the information supplied in stations’ AFRs or FSRs.
Over the past few weeks, I have been collecting every publicly available AFS in the public media ecosystem from FY2023, approximately 457 documents. I wanted to get information on stations’ revenues versus expenditures as well as assets versus liabilities, but mostly I wanted to know how much cash stations had on hand - an intriguing clue about what might happen if they lost federal funding.
In case you missed my last post, I recently made every public media station financial document from FY23 - AFRs, FSRs, and AFSes - openly available through my GitHub. To my knowledge, there’s never been a collection like this online. Soon, the data from these documents will make their way to Semipublic’s dataset, which you can learn more about here.
Caveats Aplenty
Before I continue with my analysis, there are a few disclaimers I need to make:
First is that these data are lagging indicators. Despite being the most recent financial documents available, every AFS is from FY23. Cash flows, assets, liabilities, etc. can all change drastically year-to-year.
Second is that these are not crystal ball predictions: We’re making informed - albeit educational - observations about what theoretically would happen if stations lost federal funding based on their FY23 finances.
Finally, many of the figures I am drawing from these documents (chiefly assets, liabilities, and cash on hand) are what I consider to be weak indicators. I believe they’re instructive enough to consider on their own, but can be more effective when compared against previous years.
Unfortunately, I don’t have documents from previous years at the moment, but maybe I will in the future. Stay tuned.

Bucking the Trend
Overall, stations did fairly well keeping cash on hand: I found that they ended FY23 with a little under $3 million on average. Only 29 stations, about 6% of the stations I had data for, ended that year with no cash at all.
I always like to look at the differences among states when grouping station statistics. Interestingly, there doesn’t seem to be a correlation between dependence on federal funding and lack of cash: West Virginia, for example, was the state with the highest average dependence on federal funding in FY23, yet its stations kept a relatively comfortable $4.6 million in cash on average, while neighbor Pennsylvania, a state with a relatively low reliance, kept only $1.8 million of cash on average.

In contrast, I found that only half of public media stations in FY23 had net revenues that were positive. These numbers varied wildly: Some stations lost in excess of $17 million, while others gained the same amount…or more. Losing revenue, in and of itself, isn’t necessarily a bad thing. Public radio stations aren’t driven to increase profit for profit’s sake, after all, and one year in the red doesn’t necessarily spell danger.
Averaging the stations’ net revenue out into regions shows another intriguing insight: We would expect the Midwest, a bedrock of public media, to generate revenue (it was the most profitable region, averaging over $1 in net revenue among its stations), but not the West - public media’s region most dependent on federal funding. In fact, stations in Montana and New Mexico (numbers three and four in the top five most reliant states) managed to end FY23 with a positive net revenue, while stations in California did not.
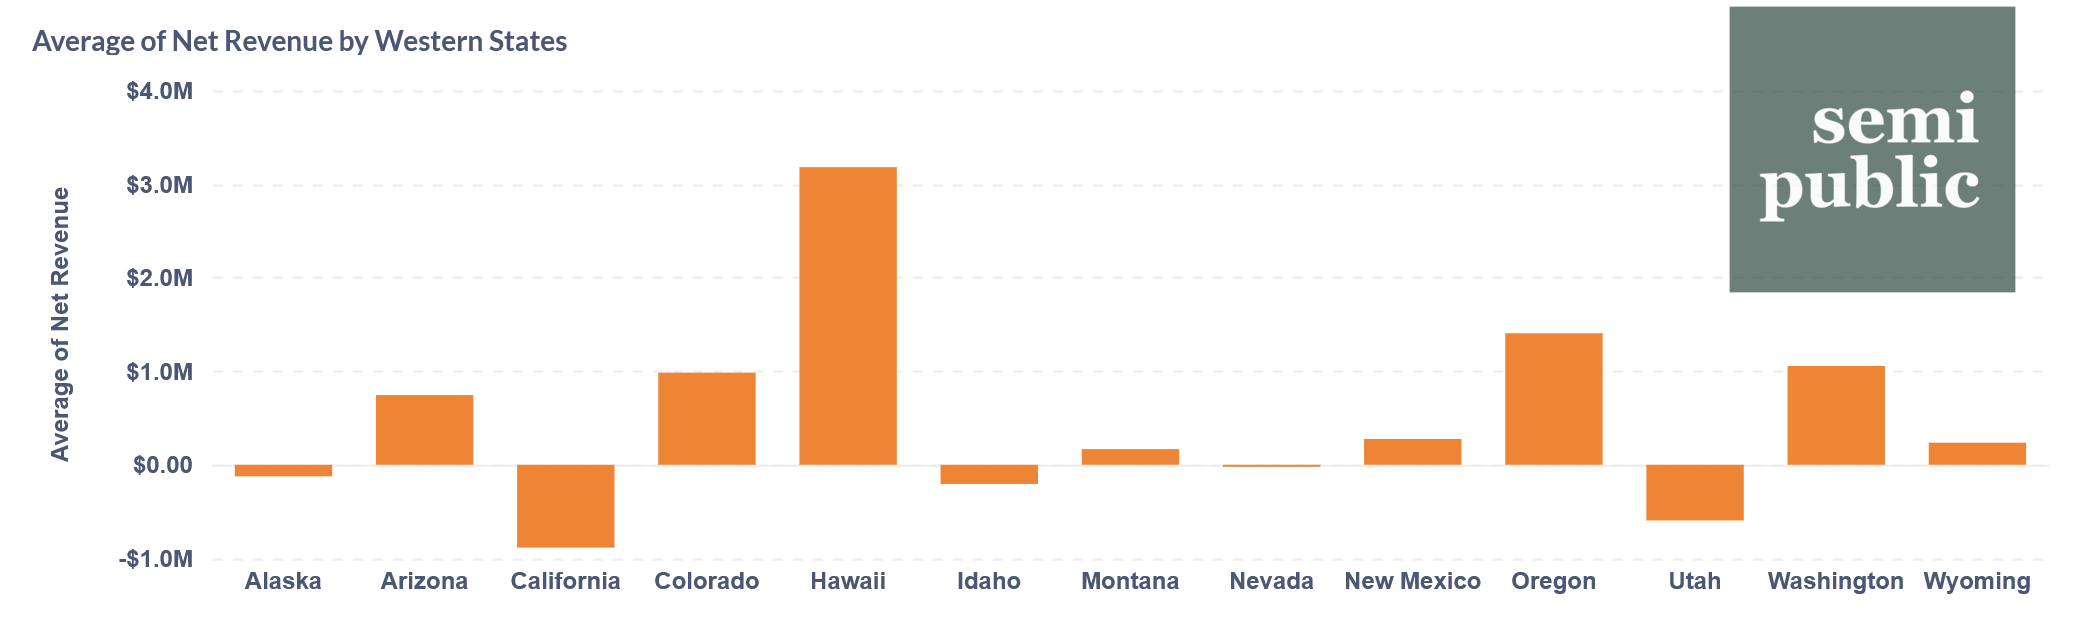
While the correlation is not absolute (Alaska had both a high average reliance on federal funding as well as negative net revenue on average in FY23), there are enough data points to suggest that federal funding, specifically CPB funding, doesn’t just help at-risk stations with expenses, it also helps them build a cash reserve. And that could mean the difference between closing immediately following the loss of federal funding, or staying afloat.
Cash (on Hand) is King
One important financial metric for public media stations - any business, really - is how many months of expenses they can cover with their existing cash and revenue. The way that we’ll be calculating this metric is by dividing the station’s cash on hand by its net revenue (total revenue minus total expenses) and multiplying by 12. In this calculation, only a net negative revenue can produce a number of months of cash on hand; otherwise, we’re assuming that the station is making enough in revenue to cover all expenses and therefore doesn’t need to burn cash.
Because public media is facing the specter of losing all of its federal funding (and not just from CPB), we’re going to up the ante by removing each station’s total FY23 federal funding from its net revenue when calculating its monthly cash on hand.
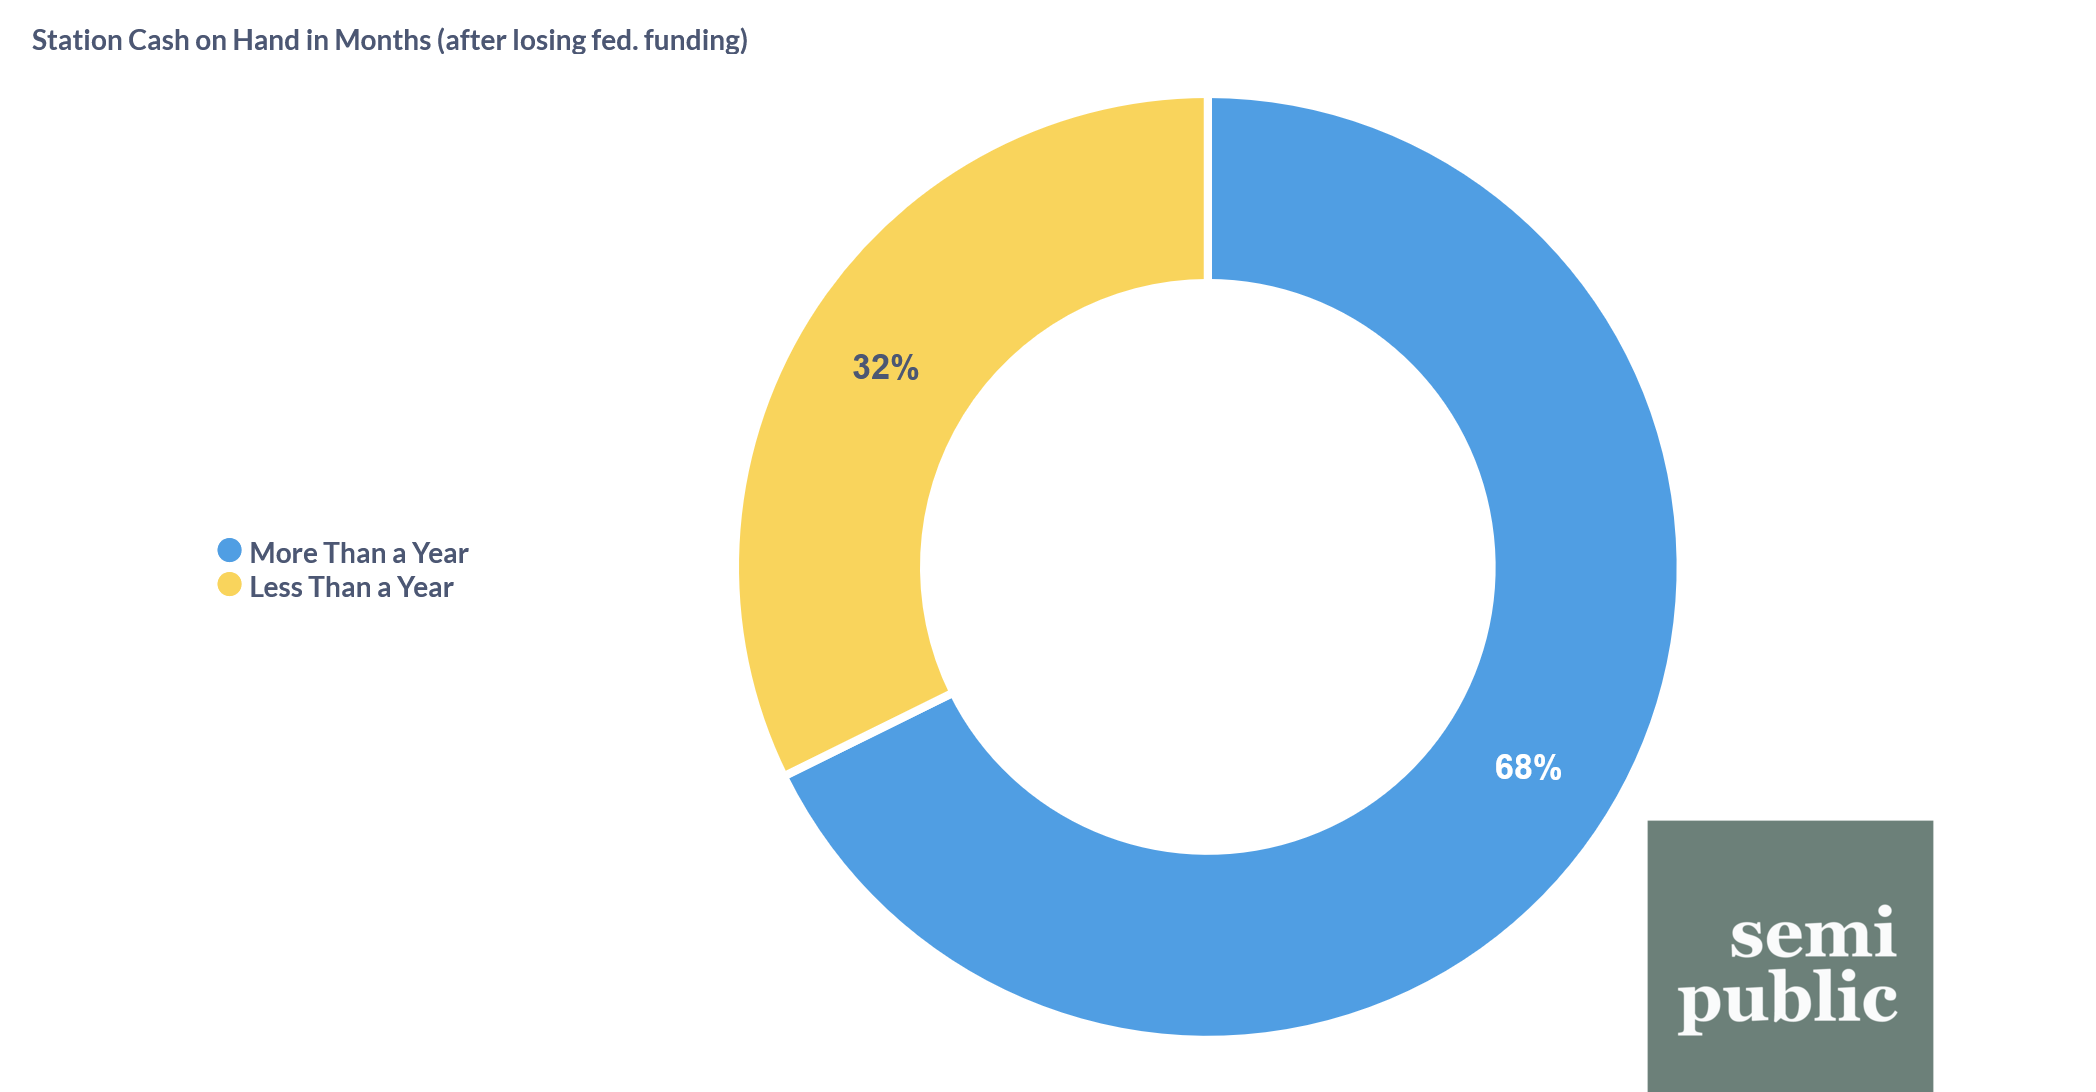
In FY2023, 25% of stations, or 112, didn’t have enough cash to cover twelve months of revenue loss. When we subtract federal funding from net revenue, that number jumps up to 32%, or 146 stations. Even more worryingly, less than 20% of all stations in this scenario would even make enough to have a positive net revenue.
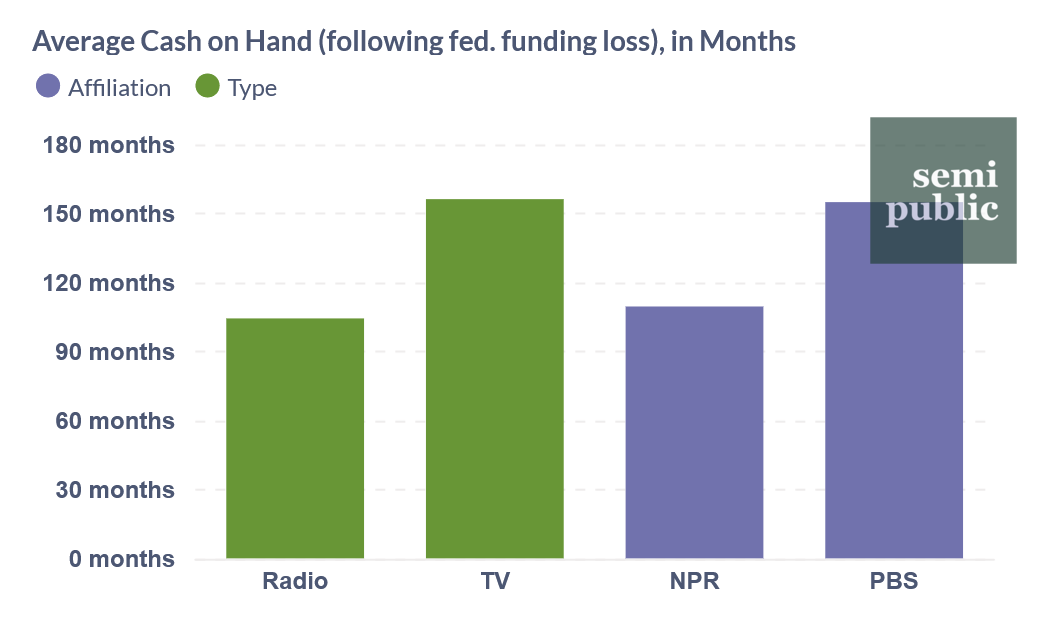
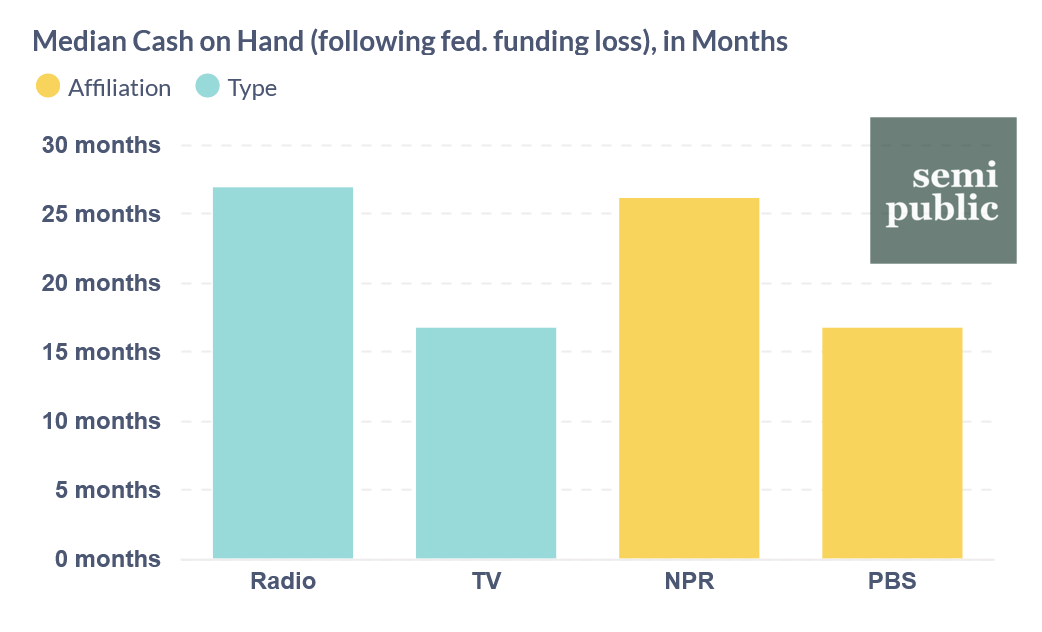
Interestingly, we again see a loose correlation between dependence on federal funding and months of cash on hand: Public television stations outperformed their radio siblings on average, as did PBS affiliates, despite having comparatively higher federal funding reliances. We also see a large discrepancy between the average months of cash on hand and the median, meaning that a few stations with massive amounts of cash on hand are skewing the average.
32% of all stations - one out of every three - is a staggering number, but not having a year’s worth of cash to cover expenses isn’t necessarily the end of the world. Thinking back to the disclaimers from before, net revenue as well as cash can fluctuate from year to year. Stations can also leverage their assets to take on more loans, or liabilities. Therefore, in order to expand our view to include the ability to leverage assets, we’ll use a simple liquidity ratio: Total assets over total liabilities.
Generally, businesses should strive for a liquidity ratio of 1 or higher - meaning that they can cover every $1 they have in liability (debts, basically) with $1 in assets. Using that goalpost to narrow down the list of stations that also have less than a year of cash on hand, we come up with the following twelve at-risk stations:

Not only would these stations and networks not be able to cover a year of net expenses following the end of federal funding, they would also have difficulty taking on new debt from banks because they already are having trouble covering their existing debt.
Low cash on hand and a low liquidity ratio doesn’t necessarily portend station closure, but I don’t think any President or GM would appreciate staring down the barrel of this scenario.
The Upshot
Here’s the good news: Even with a high number of stations with both negative net revenue and a small amount of cash on hand, public media entities are well-leveraged. A large majority of stations have plenty of assets to put towards taking on more debt in the event of losing all federal funding.
That being said, if the rescissions succeeded, half of all stations would only have enough cash to cover two years or less of their expenses. CPB’s 2026 fiscal year begins (the potential end of funding) on October 1st, is Fall of 2027 enough time to successfully change a station’s revenue strategy? It certainly isn’t enough time to wait out the current administration.
Until the fate of the rescissions package is decided, I believe we will see more public media entities cutting expenses in anticipation of preserving net revenue and cash. Yesterday, WGBH announced they’d be laying off another 45 staffers (bringing the 13-month total to 85) while American Public Media is now looking to sell its Brains On! brand of children’s podcasts as well as cut 15 positions.
Unfortunately, public media’s terrible, horrible, no good, very bad year isn’t over yet.
The idea for this week’s newsletter came from a friend. If you’re reading this, thank you.
As always, here’s a shareable dashboard containing this newsletter’s graphs and data. If you enjoyed this article, please leave a like. It’s very much appreciated.
Strong piece, Alex. But I think there’s a missing variable: human emotion, especially in the boardroom. Will board members have the courage to tap reserves or make bold, uncomfortable decisions to survive this moment? After the spectrum auction, we saw some fold entirely, converting to community foundations rather than reimagining their mission. This crisis won’t just bring closures — it will force consolidation, as weaker stations look for lifelines and stronger ones decide whether to throw them. It’s going to expose who’s willing to lead — and who’s ready to walk away.