


Here's How Many Public Media Stations Are at Risk of Closing
A study by Semipublic shows that up to 15% of local stations may not be able to survive the end of federal funding, including all stations with a reliance on federal funding of 50% or more.


Yesterday, the Senate voted to pass President Trump’s rescissions package, H.R.4, which would revoke the Corporation for Public Broadcasting’s already-appropriated funding. Days of see-sawing and indecision among some Republican Senators eventually ended with a back-room deal with the President himself: The White House conceded one amendment to remove cuts to a Bush-era AIDS relief program, gaining just enough votes for a narrow majority. Now it goes back to the House, where they must pass or fail the legislation by tomorrow.
Anything is possible of course, but right now, the cards are stacked against public media.
Last week, I drew on the extensive data-gathering and analysis that I’ve performed over the past few months to come up with a way to estimate and predict financial vulnerability in public media stations. Today, I’m going to apply that model to all of the FY23 finances I’ve collected to calculate out how many stations are at risk of closing following the loss of federal funding.

Earlier this year, I set out on a journey to collect every public media station’s financial documentation. I wanted to answer the question of what would happen if public media lost its federal funding.
Since launching Semipublic in April, my work has been featured nationally and has inspired other journalists to generate their own data-driven insights about public media.
Altogether, the work to gather, analyze, and publish the industry’s essential data has taken hundreds of hours and been done by one person: Me.
I’m proud of what Semipublic has accomplished in these few months. Now, I’m asking for your help: If you value Semipublic’s mission, or have ever benefited from insights published in this newsletter, take the time to become a paid subscriber for $8 a month. Semipublic articles will always be free, but paid subscribers get several interesting perks.
Most of all though, they help me find new ways to explore an industry in crisis - like the study below.
Updating the Curley C-Score
In case you missed last week’s article, I spent a lot of time applying existing models for predicting financial vulnerability or stress to public media finances in order to come up with a more accurate model. Ultimately, I found that looking at the ratios of net assets over total revenue as well as net income over total revenue provided a more accurate estimation than the industry model I was evaluating, Tuckman and Chang. I also standardized the calculated ratios using Z-score normalization and added the two new calculations together to form a new model: The Curley C-Score.
My new model was nearly twice as accurate as the Tuckman and Chang model when applied to certain large public media entities, 28% vs. 54%. After publishing the article, I applied the C-score to my combined AFR, FSR, and AFS dataset from FY23 with similar results, an even 50% accuracy when compared to the 30 reported station layoffs between the beginning of 2023 and now.
50-ish% is a respectable accuracy rating - especially when I look back at some of the research papers I referenced when writing last week’s newsletter - but I’m not satisfied. Public media is facing a real crisis, after all: When real people with real jobs are being threatened, we should strive to be as accurate as possible.
Luckily, there are many people in public media smarter than me, and in a conversation I had last week with one of those colleagues, they suggested I add a more precise asset liquidity measurement to the C-score.
As with the original C-score, one of the problems with existing nonprofit vulnerability models and ratios is that they’re built from 990s, which have nice, uniform datasets. Public media’s financial documentation, however, is all over the place: AFRs and FSRs only contain what CPB needs, while their AFRs vary from accountant to accountant.
When it comes to liquidity, the only uniform measurement I could find within audited statements was current assets (CA), or the amount of assets a company has that can be converted to cash within a year.

After testing several different ratio combinations, I found that current assets over total assets (CA/TA) provided the most accurate C-score when standardized using Z-score normalization and added to the other two calculations. In fact, the updated C-score correctly predicted 22 of the total 30 reported layoffs between 2023 and now, an accuracy increase from 50% to 73%.
With these three ratios, we are basically determining station financial vulnerability through:
How much income the station made (larger is better), NI/TR;
How many assets the station owns (larger is better), NA/TR;
And how much of those assets are available to convert to cash within 1 year (larger is better), CA/TA.
Let’s finally apply them to station financial data.

Station Financial Vulnerability, Before and After the Loss of Federal Funding
*Disclaimer: I understand the gravity of a prediction like this, which is why I will not be supplying the names of at-risk stations, only their state and broadcast type. My goal isn’t to put any one station on the spot, but to demonstrate how dramatically stations’ financial situations will change following the end of federal funding. Also, as I discussed earlier, the C-score is not perfect - some stations that are identified as high (or critical) risk may not experience a financial distress event in the near-future, while the inverse may be true for stations identified as low risk.
Overall, the health of the public media system in FY23, as calculated by the C-score, was - to reuse a quote - not great, not terrible. A majority of stations, 65%, were identified as being low risk, or less vulnerable to financial distress. 36%, on the other hand, were identified as having moderate to high risk of financial distress, our threshold from last week for identifying distress events like layoffs.
It should be noted that, when the C-score is applied to our normal FY23 dataset, stations with an outsized (50% or more) reliance on federal funding weren’t necessarily more at risk than their counterparts. This will be important when we subtract federal funds from station revenues later.

Interestingly, California and Vermont were the two states with the largest amount of high risk stations, with 11 and 8 respectively. While it isn’t an inverse relationship, several states with high average reliance on federal funding showed no high risk stations, notably Alaska and North Dakota.
Now let’s apply our model to the looming federal funding cuts.
In order to simulate the loss of federal funding to station finances, we have to make a few assumptions: First is that our data from FY23, while not current, is a representative enough sample to stand in for whatever public media’s current finances are. Second is that station reliance on federal funding from that same year also constitutes a representative sample. We do have more recent CPB funding data to draw upon, but station budgets are tightly bound to their federal funding and replacing FY23 numbers with that of more recent years doesn’t make sense.

Simulating the end of federal funding, in the context of calculating a C-score, is relatively simple: Each station’s federal funding is subtracted from its total revenue (TR) and net income (NI) and then reconfigured into its respective normalized ratios. In the chart above, the adjusted calculations are denoted with a “2”.
One major change you’ll notice is that we have a new C-score category: Critical. Simply put, the loss of federal funding caused several stations’ C-score to drop so dramatically that classifying them as high risk felt like an understatement.
Before, stations with a C-score of -0.5 or above were low risk, between -0.5 and -1 moderate risk, and lower than -1 high risk. A rating below -1 was outside the norm, and anything approaching -2 was rare. With federal funding subtracted from our calculations, however, we start to see some absurd C-scores, like -1550. I observed that when C-scores reached -3 or below, other normalized calculations began to reach values that seem, frankly, unsustainable. So, that’s where I placed the critical risk classification.

The Impact of Losing Federal Funding
If the rescissions package passes (and Congress fails to fund CPB in the upcoming FY26 government budget), nearly half, 48%, of all public media stations would either be at high or critical risk of financial distress. If we added stations with a moderate risk, our threshold for forecasting distress events like layoffs, that number increases to 63%.
One glimmer of hope in this projection is that 37% of stations had a solid enough financial foundation to absorb the end of federal funding without much risk. They either had enough income or enough assets that could be quickly converted to cash to weather the storm. It’s worth repeating that a station having any estimate level of financial distress does not necessarily portend public action.
So far, we’ve only discussed C-score classifications as a way to predict financial distress that would not close a station, but rather induce cost-cutting measures within the next three years. As I mentioned earlier, subtracting federal funding from station finances produced some C-scores that were so far outside the norm that I added a critical risk classification. I believe stations with this classification, 65 out of the 433 I had full financial data on (or 15%), are at risk of closing in the next three years. This includes every single public media station with a reliance on federal funding of 50% or more.
As you can see in the C-score chart from earlier, low federal funding reliance doesn’t always save a station from being at critical risk: Critical C-scores are almost directly influenced by a dramatic drop in net income. Inversely, an above-average reliance on federal funding doesn’t necessarily mean critical or high risk either: Some low risk stations had a reliance on federal funding as high as 39%.

When grouped by state, the stations identified as critical risk create a map that looks remarkably similar to that of the high risk station map from earlier. In fact, of the 85 stations that scored as high risk in the original FY23 data, 76 retained their high risk classification or converted to critical risk. Similarly, 66 of 68 stations with moderate risk either kept their moderate risk rating or were converted to high or critical. From this, we can deduce that most stations that were already at risk would continue to either be at the same risk or at greater risk of financial distress.
Conversely, 46% of the stations that were scored as low risk converted to a higher risk category following the removal of federal funding. Good finances shielded most from taking on more risk, but it wasn’t enough for many.

In previous Semipublic breakdowns, we’ve seen several interesting differences between television and radio station finances. Losing federal funding, however, appears to affect both types of public media broadcasters nearly equally: More radio broadcasters were at high or critical risk numerically, but the percentage of stations in each classification for the two types is nearly identical. Radio broadcasters had a very slight edge, with 46% of stations scoring high or critical compared to 49% of television stations.
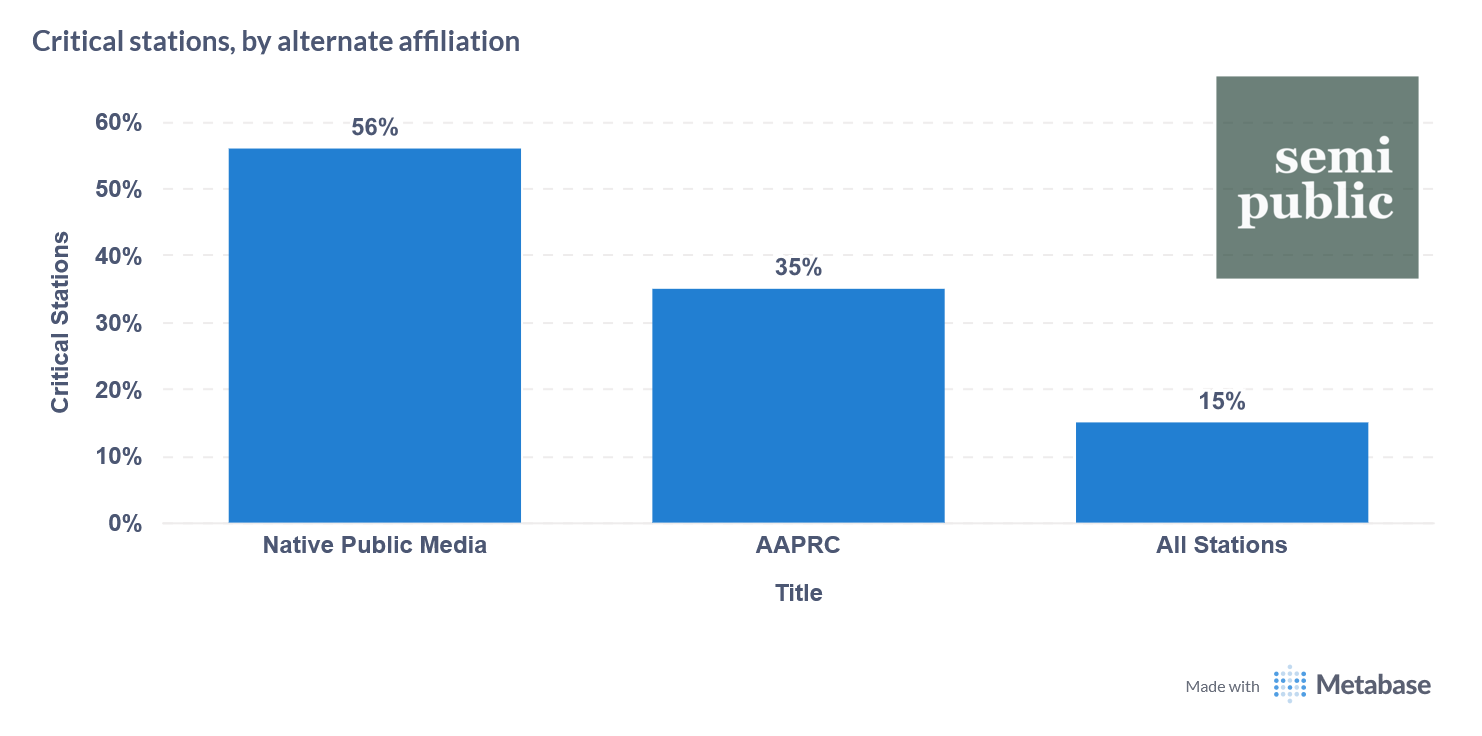
Native and tribal public media stations have, rightfully, been a key focus among lawmakers debating whether to pass the rescissions package or not. Their concerns are justified: Of every public media station affiliated with Native Public Media, 56% are at risk of closing following the end of federal funding. Similarly, 35% of all stations in the African American Public Radio Consortium scored at the same critical classification. That means AAPRC stations are two times more likely to close than other stations, while NPM stations are nearly four times more likely.
Moving Forward
I want to make sure that I write this: Public media can (and will) survive the loss of federal funding. However, I cannot overstate how destabilizing the event would be to the industry.
I also cannot overstate how unequal the effects to public media would be. The World Bank defines rural areas as having a population density of 300 people per square kilometer or less: Nearly 17% of all stations with a critical risk score are located in areas with a density of 200 people per sq. km. or less.
If we added together the populations of each town and city that critical risk stations are located in, public media as an industry could lose tens of millions of potential audience members.
As of right now, the rescissions package still hasn’t been voted on in the House. If it does pass, the fight to keep public media’s funding isn’t over: President Trump sent a recommendation to zero out CPB’s funding for the FY26 budget, but Congress may decide to ignore it. Additionally, several senators seem confident there will be a deal for native public media stations.
It’s clear that the focus on local impact and native stations are effective arguments against defunding public media. Now that they’re out in the world, all we can do is wait.
As always, here’s a shareable dashboard containing this newsletter’s graphs and data. If you enjoyed this article, please leave a like. It’s very much appreciated.