


Estimating and Predicting Financial Distress in Public Media Entities
Public media's federal and state funding is no longer guaranteed. Is there a way to calculate which stations can weather the storm?


There’s no question that running a broadcast media service can be a financially unstable endeavor. Look at what’s happened to commercial radio: As advertising spending has (gently) shifted away from AM/FM to digital streaming, radio conglomerates have gobbled up thousands of local stations. iHeartRadio alone owned 870 stations in 151 markets as of 2023.
Public media stations, on the other hand, benefit from a system that was designed with financial stability in mind, mostly due to federal funding. That doesn’t mean that public media is completely shielded from crises - several public radio entities suffered from a drop in podcast underwriting spending after the COVID pandemic - but they typically don’t represent an existential threat.
That is, until now. While public media’s federal funding hangs in the balance (President Trump’s rescissions package as well as his budget proposal eliminating CPB are making their way through Congressional appropriations processes), several states have begun slashing or eliminating entirely their own funding for public media stations. For stations with an extremely high reliance on federal and state funding, these cuts would undoubtedly portend closure. But for stations with just an above-average reliance, the question of their survival is a lot more complicated.
When I started Semipublic back in April, I was focused on expressing station financial vulnerability only through how much of their total revenue came from federal sources. Since then, I’ve broadened the newsletter’s scope to include more granular explorations of datapoints like donation revenue, cash on hand, and non-operating revenue, all with the hopes of using them to estimate not just how vulnerable a station is, but what might happen to it following the loss of federal funding.
Today, I will combine the knowledge gathered over the past few months to do just that.

I originally started Semipublic because I was frustrated: Most reporting about public media, at the time, parroted the same vague statistics about the industry’s reliance on federal funding. I wanted real, data-driven insights not just about public media as a whole, but also about which stations could be affected the most.
In late winter, I set out on a journey to collect every station’s publicly-available financial documentation and ingest them into a centralized database, which would then drive the insights I’d been looking for. Since launching Semipublic in April, my work has been featured nationally and has inspired other journalists to generate their own data-driven insights about public media.
Altogether, the work to gather, analyze, and publish the industry’s essential data has taken hundreds of hours and been done by one person: Me.
I’m proud of what Semipublic has accomplished in these few months. Now, I’m asking for your help: If you value Semipublic’s mission, or have ever benefited from insights published in this newsletter, take the time to become a paid subscriber for $8 a month. Semipublic articles will always be free, but paid subscribers get several interesting perks.
Most of all though, they help me find new ways to explore what’s next for an industry in crisis - like the model I’ve developed below.
The Trouble With Established Non-Profit Vulnerability Models
Admittedly, developing a custom model for estimating financial vulnerability in public media entities isn’t a new idea for me. I was a little bit obsessed with the idea when I was a new Product Manager for PRSS and pitched the idea to a trusted co-worker. The company had no real use for something like that at the time, and my co-worker reminded me, rightfully, that there were more important things for me to focus on. But before I stored the idea away, I did a bit of research on methods similar to my idea that already existed.

One of the most famous, and still widely-used today, is the Ohlson O-score. Developed by Dr. James Ohlson of NYU in 1980, the model is designed to measure financial distress in publicly-traded, for-profit companies by outputting a single score - the “O-score.” There are essentially six measurements that constitute the Ohlson O-score:
Total liabilities over total assets (TL/TA),
Working capital over total assets (WC/TA),
Current liabilities over current assets (CL/CA),
Net income over total assets (NI/TA),
Funds from operations over total liabilities (FFO/TL),
And the year-to-year change in net income.
Each variable is weighted by importance and measured against that year’s gross national product (GNP) to ensure accuracy.
The Ohlson O-score is still heavily used today, mostly among bankers evaluating corporate loan applications and investors. There are two problems when applying the model to public radio stations, however: The first is that, while the O-score can provide reasonably accurate estimations of financial distress in for-profit companies, its efficacy for non-for-profit companies falls dramatically. The second is that granular measurements like current liabilities and assets as well as funds from operations can be difficult to divine from AFRs and AFSes alone. Even if we decided on a reasonable approximation for each, it wouldn’t make any sense to try and tweak a model that isn’t very accurate anyway.
Which brings us to our next approximation method: Howard Tuckman and Cyril Chang’s 1991 model. Originally published in Nonprofit and Voluntary Sector Quarterly, this model was developed to measure financial vulnerability in non-profits, as opposed to financial distress. Like the O-score, Tuckman and Chang’s model relies on financial ratios - this time, only four:
Net assets over total revenue (NA/TR),
Revenue concentration (RCI), where 1 is divided by the number of revenue sources,
Net income over total revenue (NI/TR),
And administrative expenses over total revenue (AE/TR).
According to Tuckman and Chang, a low NA/TR ratio means the non-profit doesn’t have enough assets to convert to cash; an RCI approaching 1 means the non-profit doesn’t have a diverse enough revenue stream; a low NI/TR ratio signals cash flow problems; and
The strength of this model when applied to public media stations comes from the fact that it was built specifically for non-profits. Additionally, gauging a non-profit’s financial vulnerability is much simpler than the O-score. There’s no complicated formula: Starting at 0, you add 1 for every ratio calculation that is harmfully low or high, depending on the ratio. So, a score of 0 means no vulnerability, while a score of 4 means absolute vulnerability.
Unfortunately, Tuckman and Chang’s model also presents challenges with some of its granular measurements, specifically revenue concentration and administrative expenses. Without a 990, each of these would either be a guess or a near approximation for public media stations.
Luckily, we may not need all four of these ratios. Several studies have shown that Tuckman and Chang’s model can be more effective at estimating non-profit financial vulnerability than others (including the Ohlson O-score). One in particular from Ben-Gurion University in 2014 found that not only can the model’s efficacy increase when narrowed down to just one or two variables, but that it could also significantly predict vulnerability over a three-year period.
If we could find a way to adapt Tuckman and Chang’s model to our station financial data from 2023, not only could we figure out which stations are currently financially vulnerable, we could also predict which stations would become vulnerable following the end of federal funding.

Testing Tuckman and Chang on Public Media 990s
Before we begin applying the Tuckman and Chang model to public media station data, we need to test it on more reliable data from public media entities that span several years. After all, public media has a unique insulation from typical financial vulnerability as we discussed before: It gets a guaranteed federal subsidy (at least, up until now).
Using the power of n8n, I collected ten years of 990 data from the following major public media entities: NPR, PBS, PRX, Sesame Workshop, NY Public Radio, WNET, KQED, WGBH, APM/MPR, and Storycorps.
NA/TR, NI/TR, and AE/TR are easy enough to extract from 990s, but RCI presented several challenges. In the end, I decided for both 990 data and station data to switch this ratio out with federal grants over total revenue - reliance on federal revenue. I’ve established in previous newsletters how important this metric is for public media, and while it isn’t the same as revenue diversity, the actual ratio functions much the same as RCI: The closer to 1, the more dependent the entity is on fewer revenue sources (one in particular).
Another change I made for both 990 and station data was to normalize the calculated ratios. Because there were several major outliers in each dataset, I employed Z-score normalization, which produced consistent values across all four ratios, mostly clustered between -1 and 1. If a Z-score value was, say, -0.5, that means that the calculated ratio before normalization was below the median. The same goes for a Z-score value of 0.5, except that this time, the value was above the median. If a Z-score value was more than 1 or less than -1, that means the calculated ratio before normalization was higher or lower than the median by at least one standard deviation.
When assigning a point to a ratio when calculating the final score, I set the bounds between -0.3 and 0.3: A normalized ratio of -0.3 or lower for NA/TR, AE/TR, or NI/TR earned a point each, while a normalized ratio of 0.3 or higher for Grants/TR earned a point
Disclaimer: Other than divination, there’s only one real way I could match estimated financial vulnerability with reality, and that’s with news reports about layoffs, which for the sake of this newsletter I’ll categorize as a “financial distress event.” Not every financially vulnerable year portends a financial distress event of course, and as you’ll see, not all financial distress events are triggered by financially vulnerable years.
Let’s start with PBS: As you can see in the chart above, the Tuckman and Chang model identifies three years, 2014, 2015, and 2018, as having moderate financial vulnerability with a score of 2/4. However, according to Current, PBS experienced layoffs in 2016, 2020, and 2024. If we use the Ben-Gurion University study finding that the Tuckman and Chang model could predict financial vulnerability over the following three years, our scores predict the layoffs in 2016 and 2020. There are two problems with these, however: First is that each correctly-identified year only gives a moderate indication, which I believe is not strong enough for our purposes (and as you’ll see later, its not consistent with other findings). Second is that it completely fails to predict 2024’s financial vulnerability.

When we apply the model to NPR’s 990s between 2013 and 2022, however, the results were worse: The Tuckman and Chang score more or less failed to predict any financial distress events, especially those in 2013, 2019, 2022, and 2023. (I consider a score of 1/4, slight financial vulnerability, to be a miss). The same happened with KQED, APM/MPR, and NY Public Radio.
The model correctly predicted one financial distress event at WNET in 2024 (with one false positive), two of three distress events (2013, 2015, and 2025) at Sesame Workshop, one distress event at Storycorps in 2024 (with two false positives, though SC workers formed a union in 2017, which could affect the likelihood of a layoff occurring), and failed to predict a 2025 financial distress event at WGBH.

Interestingly, PRX was the only 990 organization to have a Tuckman Chang score of 3/4, or highly vulnerable, on any given year. In fact, that score happened three different times: 2020, 2022, and 2023. Additionally, the organization only ever had a score of 1/4 for one year, 2014: The rest reached a vulnerability score that would have triggered a financial distress event at the other measured 990 organizations. PRX experienced financial distress events in 2018 and 2023, thus correctly predicting both events with two false positives (2013 and 2019) when a three-year predictive buffer is added.
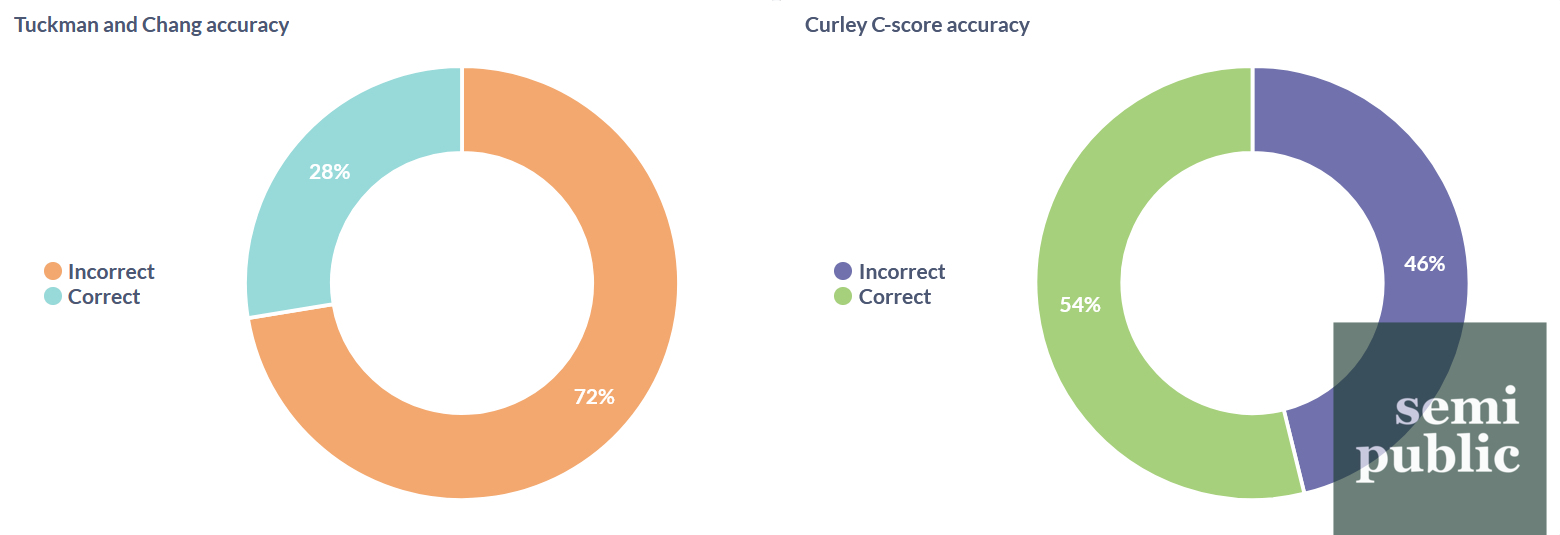
Altogether, the Tuckman and Chang model correctly predicted about 28% of all financial distress events among our ten organizations with 990s. However, as we talked about earlier, the generated scores didn’t necessarily reflect the urgency of the financial vulnerability. Plus, we had several years that were flat-out wrong: They did not show vulnerability even when we know that it occurred, especially in the beginning of 2020 (reflected in 990s as 2019). How can we improve, especially when considering available station data?

New Variables, New Scores
To begin with, we needed to fix the problem of administrative expenses. Station Audited Financial Statements don’t reliably segment out these expenses the same way 990s do, and Annual Financial Reports and Financial Statement Reports don’t at all.
To compensate, I added total expenses over total revenue (TE/TR) to the list of normalized ratios. Having a higher-than-average amount of expenses in relation to revenue is undesirable, the logic goes, therefore the higher the normalized ratio, the more financially vulnerable the public media entity.
Last month, I posited that cash-on-hand was an important consideration for stations facing the prospect of losing their federal funding. Therefore, I also added cash over net income (C/NI): Stations with a below-average amount of cash, or a negative income, should theoretically be more vulnerable than stations with an above-average amount.
Finally, I added salaries over total revenue (Sal/TR): Public media entities with a higher-than-normal salary obligation would be more likely to be financial vulnerable and reduce that obligation through a distress event (like layoffs).
To make a long story short, I found that, among the new variables, only TE/TR had a significant relationship with estimating financial vulnerability, but that’s only because it has a direct correlation with an existing Tuckman and Chang variable: NI/TR. Indeed, if you look at the graph with the new variables, you’ll see they’re almost mirrors of each other. Neither C/NI nor Sal/TR were very reliable: The latter was highly dependent on the organization (Storycorps spends a lot on salaries in relation to revenue, for example, while PRX does not) while the former had no correlation whatsoever.
In their 2014 study, the researchers at Ben-Gurion University found that AE/TR and RCI were the strongest predictors of financial vulnerability in the Tuckman and Chang model. I, however, found that NA/TR and NI/TR were the strongest predictors among public media entities.
As I talked about before, I was dissatisfied with the scores tabulated by Tuckman and Chang’s model, specifically the lack of strength indicated by the scoring system out of four. There had to be a better, more precise way of combining the calculated ratios into a reasonable estimate. I played around with several different methods before I came back to the simplest, and most accurate: Why not just add the normalized ratio calculations together?
Introducing the Curley C-score
Because I found NA/TR and NI/TR to be the strongest predictors of financial vulnerability in public media entities, I chose them to be combined (after Z-score normalization) to make a new score, which I’m calling the Curley C-score.
The C-score can be understood simply: The more negative the score (denoted in the graphs below as “absCscore”), the more financially vulnerable the public media entity is. For ease of use, I also divided C-scores into categories: Scores above -0.5 indicate “Low” vulnerability, scores between -0.5 and -1 indicate “Moderate” vulnerability, and scores below -1 indicate “High” vulnerability.

Earlier, we found that the Tuckman and Chang model failed to predict financial distress events in several of our measured 990 entities, especially New York Public Radio. When we apply the C-score, however, all four (2021, 2023, 2024, and 2025) financial distress events are correctly identified with four “Moderate” vulnerability years and one “High” vulnerability year.

Similarly, the C-score accurately predicted two financial distress events for APM/MPR (2020, 2022) whereas the Tuckman and Chang model did not. Admittedly, the correct prediction for the 2022 event is the very upper bounds of the three-year prediction period laid out by the Ben-Gurion University researchers, but the Tuckman and Chang model failed to identify any meaningfully vulnerable years at all.
Overall, the new C-score correctly predicted financial distress events over 54% of the time for all of our measured 990 organizations, with the 46% failures being both missed distress events as well as false positives. That’s nearly twice the success rate of the Tuckman and Chang model, which also included several more false positives in its scores than the C-score did.
What Now?
While the new Curley C-score isn’t perfect, we’ve demonstrated with our 990 dataset that it’s significantly more accurate than the Tuckman and Chang model. Furthermore, it produced fewer false positives and provided a clearer representation of how vulnerable the organizations actually were for the given fiscal year.
I developed the C-score specifically for public media stations and their unique financial reporting. While this certainly isn’t the final form of this model (there’s always some way to improve), I believe that we can use the C-score to help estimate station losses in the event of losing all federal funding by factoring in that loss to both total revenue and net income from our FY23 dataset.
Then, we can better understand the impact it will have on public media’s producers, networks, and the system as a whole - and plan for the future.
Sometimes, it’s hard to tell how my articles perform: If you enjoyed this one, please leave a like and a comment. Also, consider becoming a paid subscriber and help me continue to find new ways to think about public media’s future.